Supply and demand report
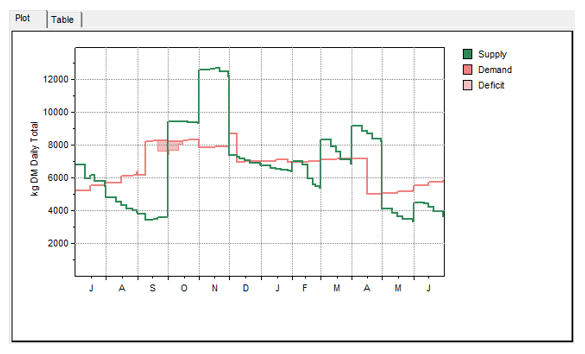
The Supply/Demand report provides both a plot and a table to summarise the feed supply and demand for a model. Values for supply and demand can be viewed as a farm total, per head or per hectare. In addition to this, the units can be adjusted to display as Dry matter or Metabolisable energy.
Supply comprises of:
Standardised Pasture net growth, as defined on the Net Growth report.
Crop Adjustment which includes any values for conservation crops on farm.
Supplements fed as defined on the Supplements screen.
Waste as calculated using the utilisation values given in the Crops and Feeds database.
Total supply = Pasture + Supplements + Crop Adjustment – Waste.
Demand:
Total demand as defined on the Intake screen.
Supplements fed as defined on the Supplements screen.
Pasture demand = Total - Supplement - Deficit.
Difference
Difference = the value of Supply minus Demand. If this value is relatively low in any particular months it provides an indication that reaching production goals with projected feed may be tight. If the difference is negative, the farm will be infeasible, indicating there is not enough feed to match demand requirements for the month.
If the farm is feasible:
Pasture demand will equal Pasture Eaten.
When supply exceeds demand, pasture cover will accumulate.
When demand exceeds supply, pasture cover will be reduced.